Add New Range Series to Existing Chart in Microsoft Excel
Excel
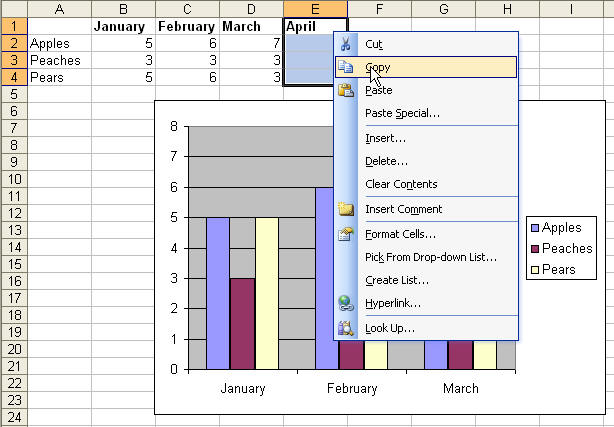
I've often received phone calls from frustrated users asking a basic question about how to add a new series to charts. They're sick of right-clicking the chart and hitting the Source Data option, as shown below.
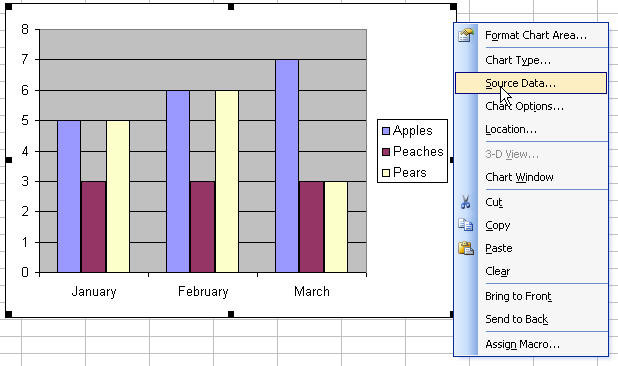
Well, for the chart above, and for most charts, there's really no need to take all those steps.
Instead, select your new data series' cells, and copy them. Then click on the chart itself, and paste. That's right...copy and paste your series data right onto your chart.