Millions and Thousands in Charts in Microsoft Excel
Excel
There's a really easy way to show the values in charts in millions and thousands...dropping the trailing zeroes.
For this, we're also going to get a bit more detail. Double-click right on one of the numbers you want to change. Go to the Scaling tab. Very interesting settings here.
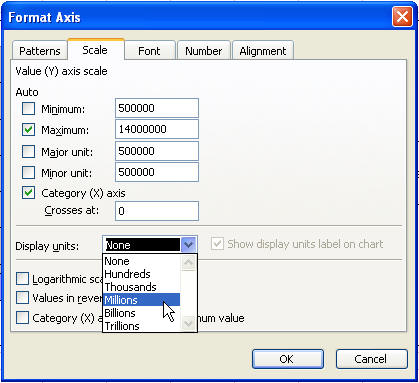
We'll start at 500,000, since no value is less than 1,000,000, but because we want to see more closely the value levels, I change the major and minor units to 1/2-million as well, then I choose to Display Units in Millions.
Now our numbers are all scrunched up, so we make the chart taller.